Rainmeter, HWiNFO, and Lua
07 Mar 2015A random learning fun time brought to you by Evolve and thermodynamics. When I started to play Evovle heavily, it became apparent that something was very wrong with my current desktop configuration. Around 50% of my matches were curtailed via glorious RSODs or a very manly statement by my GPU:
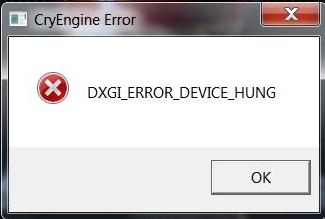
Hilariously enough, if you Google CryEngine DXGI_ERROR_DEVICE_HUNG, it would seem CryEngine occasionally misplaces your video card. However, in reality, these are symptoms of much larger problems. Because I want to get the fun part involving software, the short version of the problem is that my CPU was being thermal throttled. After replacing my three year old-ish thermal compound which flaked off like a sunburn, my CPU stopped being throttled and I haven't seen any RSODs or DXGI errors. The rest of this post is how I figured that out and ended up building a fun little widget.
Instrumentation
I've always loved system monitoring tools like SpeedFan and Open Hardware Monitor. However, they never really had a everything I was looking for in one place. I then discovered HWiNFO. HWiNFO detects all sorts of fun little sensors within your machine. The best part is that it has an interface by which to pull all the sensor data. I then discovered it was integrated with a Windows widget program I have already been using, Rainmeter. Rainmeter is a great project that aims to provide a basic configuration system which allows for some pretty elaborate desktops.
Yes, those are all dynamic widgets. You can browse more great looking ones here. This means I can have something that doesn't look like I vomited in mspaint (AKA Programmer Art)!
Rainmeter has a very simple paradigm. You have measures (sensor/information sources) and meters (shiny graphical bits). There are of course more features packed in that can make a configuration file very complex. One of the downsides to Rainmeter is if you aren't using the stock measures then it becomes really difficult to make a skin portable to another user's machine. Since I wanted access to the interesting sensors in HWiNFO, I had to figure out how the Rainmeter plugin system could make use of HWiNFO's API.
Oh look, there's a thing for that. After downloading HWiNFO's bundled example Rainmeter skin (.rmskin), I started it up and didn't get any readings on the widget itself, which wasn't surprising considering this wasn't using the basic measures from Rainmeter. Curious as to the details of the plugin system, I started learning how to configure HWiNFO to load sensor data, and more importantly to make sure the memory sharing option was enabled. Even after that, I had no luck, so I started digging into the configuration for the Rainmeter skin itself. At this point I now realized how difficult it would be to make Rainmeter and HWiNFO portable to other machines. Each data source has a hex value that represents the sensor and different values from the sensor. This can vary from machine to machine. After changing some hex values around in the demo Rainmeter skin I was able to get data! Here's what accessing HWiNFO data from Rainmeter looks like:
[CPUName]
Measure=Plugin
Plugin=HWiNFO.dll
;Shared Memory Locations
HWiNFOSensorId=0xf0000300
HWiNFOSensorInstance=0x0
HWiNFOType=SensorName
;String manipulation so we just get the CPU name
Substitute="CPU [#0]: ":""

[CPUUsage]
Measure=Plugin
Plugin=HWiNFO.dll
;Shared Memory Locations
HWiNFOSensorId=0xf0000300
HWiNFOSensorInstance=0x0
HWiNFOEntryId=0x7000009
HWiNFOType=CurrentValue
Since we can't really expect to download a portable skin...let's build one!
Detour #1: Update Frequency
Rainmeter skins have a setting (Update and UpdateDivider) that dictates how frequently they update so you don't spend CPU cycles updating the second hand on your fancy clock five million times a second. HWiNFO also has the same idea where it will only interrogate the sensors every x milliseconds. I wanted frequent updates from HWiNFO because I wanted to see very spikey information such as hard drive access or spikes in core usage. So I cranked up the frequency in HWiNFO to 100ms intervals, or ten times a second.
Tragically, the numbers in HWiNFO were only updating about once every two seconds, quite the opposite of what I was attempting. After some reading on the HWiNFO forums, it would seem that the interrogation of Embedded Controller (EC) and Self-Monitoring, Analysis and Reporting Technology (SMART) sensors takes FOREVER (AKA two seconds). So I turned those off and bam, numbers jumping all over the place. I then turned the frequency back down to 1000ms since HWiNFO started to consistently eat about 5% CPU.
Pro Tip: Disable monitoring of all EC and S.M.A.R.T. sensors in HWiNFO.
Detour #2: Blending Color Scales
Now that I had all the numbers at a frequency that seemed reasonable, I wanted to make a really compact and informative Rainmeter skin. The idea was to layer multiple roundline meters to give a quick view of multiple sensors related to each other. The most important part of this layout was to be the coloring of various outputs. I wanted to "simply" blend from green to red when a sensor was reporting bad news. At first I tried using bulky logic within the Rainmeter configurations, but this would only get me a stark color change at 50 and 75 percent. I'm not quite sure why, but it became very important to me that the colors blend seemlessly over the meter.

My second attempt is recorded here, where I tried to write ranged linear conversions in the Rainmeter skin configuration. That's was a bad idea. I even started looking at submitting a pull request, but wasn't sure if people were taking advantage of the weird behavior of the RGBA notation. Anyways, this all lead me to another great feature of Rainmeter, Lua scripting! That last sentence is difficult for me because I have a violent allergic reaction to languages who don't have zero based arrays or use tilde's in their inequality operators. Regardless of my predisposition to Lua, it was time to whip something up and see what happens. After about an hour I ended up with this. A nice little Lua script to extend the functionality of blending colors in Rainmeter configurations. It ends up looking like this in Rainmeter:
[ExampleColorMeasure]
Measure=Script
ScriptFile=BlendColor.lua
MeasureToBlend=SomeMeasureWithMinMaxSet
RedScale=50,75,0,255|75,100,255,255
GreenScale=0,50,255,255|50,75,255,0
AlphaScale=0,50,64,64|50,100,64,255

;Using this measure is as simple as:
LineColor=[ExampleColorMeasure]
The nice folks on the Rainmeter team have since fixed the Clamp() bug, but there still remains no easy way of blending colors along multiple scales within skin configurations.
The Results
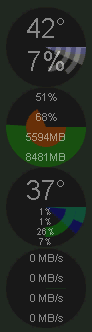
After this wonderful little journey, I wound up with four meters which covered my CPU, RAM, GPU, and disk. They helped me diagnose that my real problem wasn't my GPU but my CPU trying to bore its way to the Eath's core.
The first meter represents the CPU. There are three elements here. A white line will move across the full radius of the circle representing the total percentage of the CPU being used. This is also printed on the lower half of the meter. If you look closely you will also see eight individual white lines moving across segments of the radius. Each of these represents the usage of the threads within each core. For my CPU this is eight because I have four cores with two threads per core. The final element is four lines which moves across two thread lengths of the radius representing the tempurature of the core (remember each core has two threads). This line blends from blue to red representing the temperature, the highest of which is printed on the top half of the circle. The neat thing about this is that I can see which cores are heating up faster. Oddly, my fourth core heats up faster than any other when running prime95. I also have logic which turns the entire meter bright red when it is being throttled, but I can't really show that now because I replace the thermal compound. Below you can see the meter when starting up and shutting down prime95:

The second meter is simple. Two lines representing my physical and virtual memory.

The third meter is for the GPU. A blue to red line across the full radius represents the temperature along with being printed at the top. The 4 segments within the circle from center to edge are: Core usage, D3D usage, Memory usage, and Memory Controller usage. There are also sensors for video and video bus, but those only usually light up when you are decoding something, so not really that interesting which is why they are not represented here.

Finally, the fourth meter, which is pretty boring most of the time. It represents the disk activity. I have this split into two because I have an SSD and then a RAID array. The inner ring represents the first drive (OS), and the outer ring represents the second drive (not OS data). The top two numbers represent the read rates within their respective circles, and the bottom two represent the write rates within their repective circles. As you can see, he's very boring when no one is loading anything:

Let's see what all of them together look like when Evolve starts and loads a level. Keep in mind I am also running CamStudio to capture this so my CPU is already a bit spun up and my OS drive starts kicking in for swap file usage. There is also a point where the image blinks, this would be Evovle going fullscreen. So, start, initial loading and intro videos, then level load, then shutdown. This is what is looks like over two minutes:
That seemed like a lot of work
Yeah, but it was fun! More importantly, I would have never known that my CPU was the problem because many early i7's like mine run "hot" around 90c, but not many programs tap into the "Thermal Throttle" sensor that I found in HWiNFO. That just confirmed that my problem was with my CPU when I couldn't even run unmodded Skyrim without being throttled.
I'm posting the rmskin as a demo here as well. This will probably NOT work fully without some configuration from you because it is expecting a specific core count and disk drive count, but most of the data should work.